We are equitable, diverse, and inclusive
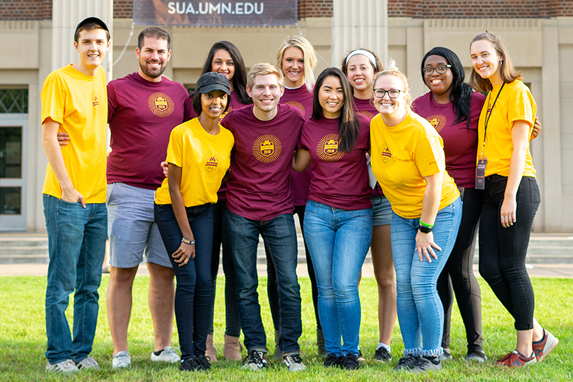
Sense of Belonging
An important consideration for any effective postsecondary institution is how well all those it serves are welcomed and supported in their studies and their work. Measures of positive engagement with the University for students, faculty, and staff are essential markers of organizational effectiveness and individual well-being, driving further success measures such as increased student and staff retention and overall productivity.
In a recent survey of students on the Twin Cities campus, 88.0% responded that they had a sense of belonging at the University of Minnesota, up 10 percentage points from 77.9% the previous year. Among AAU institutions participating in the Student Experience in the Research University (SERU) survey in 2022, the University of Minnesota ranked the highest in having a sense of belonging on campus.
Source: Student Experience in the Research University (SERU) Survey, Spring 2022 responses indicating students agree with the statement "I feel I belong at [institution name." Note: Other institutions are not individually identified per SERU data governance.
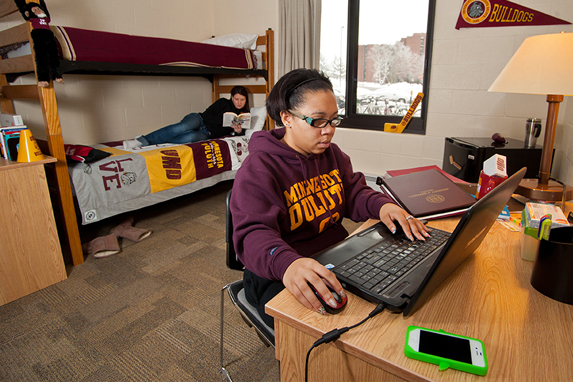
Recruit Diverse Students
The percentage of incoming Fall 2022 freshman students who identify as BIPOC systemwide is the highest in recorded history at 31%, a nearly 10% increase in five years.
Percentage of Systemwide New Freshman BIPOC Enrollments, 2017–2022
All campuses have seen an increase in the percentage of incoming undergraduate students who identify as BIPOC since 2017.
Percentage of Campus New Freshman BIPOC Enrollments, 2017–2022 (Crookston Campus)
Source: Institutional Data and Research, University of Minnesota (https://idr.umn.edu/reports-by-topic-enrollment/enrollments)
Percentage of Campus New Freshman BIPOC Enrollments, 2017–2022 (Duluth Campus)
Source: Institutional Data and Research, University of Minnesota (https://idr.umn.edu/reports-by-topic-enrollment/enrollments)
Percentage of Campus New Freshman BIPOC Enrollments, 2017–2022 (Morris Campus)
Source: Institutional Data and Research, University of Minnesota (https://idr.umn.edu/reports-by-topic-enrollment/enrollments)
Percentage of Campus New Freshman BIPOC Enrollments, 2017–2022 (Rochester Campus)
Source: Institutional Data and Research, University of Minnesota (https://idr.umn.edu/reports-by-topic-enrollment/enrollments)
Percentage of Campus New Freshman BIPOC Enrollments, 2017–2022 (Twin Cities Campus)
Source: Institutional Data and Research, University of Minnesota (https://idr.umn.edu/reports-by-topic-enrollment/enrollments)
Local Business Partnerships
The University is committed to promoting robust supplier diversity by contracting with businesses owned and operated by women, BIPOC and disabled persons. In FY22, the number of these Minnesota-based suppliers rose to 300 from 271 in FY21. In FY22, the University spent nearly $42 million with these suppliers for goods, services and construction.
Suppliers owned by women, BIPOC persons, and disabled persons often connect fellow businesses with the University, deepening the connections and broadening opportunities for both the University and the suppliers.
| Fiscal Year | Number of MN-based woman, BIPOC, and disabled-owned suppliers to the University | University spend with these suppliers | Percent of total University spend |
|---|---|---|---|
| FY19 | 271 | $34,961,524 | 5% |
| FY20 | 279 | $39,729,520 | 6% |
| FY21 | 243 | $22,842,247 | 4% |
| FY22 | 300 | $41,793,170 | 6% |
Map of the University's Minnesota-based Women, BIPOC, and Disabled-owned suppliers in FY22

